Note
Click here to download the full example code
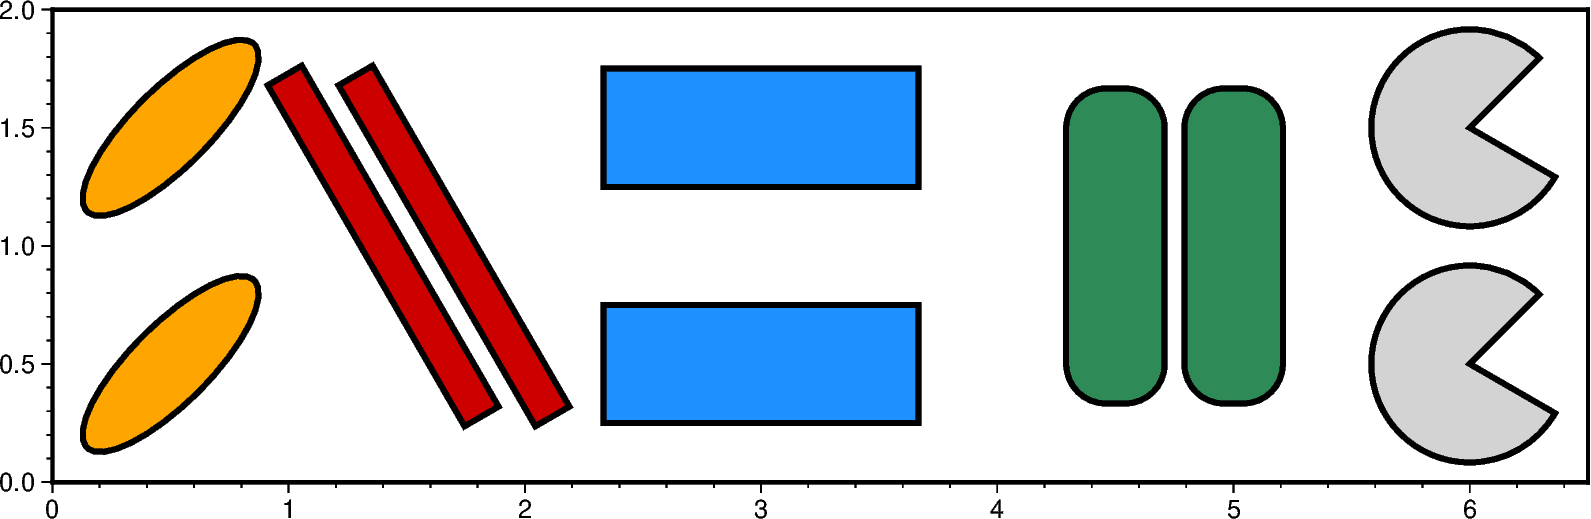
Multi-parameter symbols
The pygmt.Figure.plot method can plot individual multi-parameter
symbols by passing the corresponding shortcuts listed below to the style
parameter. Additionally, we can define the required parameters in a 2d list or
numpy array ([[parameters]] for a single symbol or
[[parameters_1],[parameters_2],[parameters_i]] for several ones) or use an
appropriately formatted input file and pass it to data.
Alternatively, the required parameters can also be set after those shortcuts
via the style parameter.
The following symbols are available:
e: ellipse,
[[lon, lat, direction, major_axis, minor_axis]]j: rotated rectangle,
[[lon, lat, direction, width, height]]r: rectangle,
[[lon, lat, width, height]]R: rounded rectangle,
[[lon, lat, width, height, radius]]w: pie wedge,
[[lon, lat, radius, startdir, stopdir]], the last two arguments are directions given in degrees counter-clockwise from horizontal
Upper-case versions E, J, and W are similar to e, j and w but expect geographic azimuths and distances.
Out:
<IPython.core.display.Image object>
import pygmt

fig = pygmt.Figure()
fig.basemap(region=[0, 6.5, 0, 2], projection="x3c", frame=True)

# ELLIPSE 1
data = [[0.5, 0.5, 45, 3, 1]]
fig.plot(data=data, style="e", color="orange", pen="2p,black")

# ELLIPSE 2
# direction/major_axis/minor_axis are given via the style parameter
fig.plot(x=0.5, y=1.5, style="e45/3/1", color="orange", pen="2p,black")

# ROTATED RECTANGLE 1
data = [[1.4, 1, 120, 5, 0.5]]
fig.plot(data=data, style="j", color="red3", pen="2p,black")

# ROTATED RECTANGLE 2
# direction/width/height are given via the style parameter
fig.plot(x=1.7, y=1, style="j120/5/0.5", color="red3", pen="2p,black")

# RECTANGLE 1
data = [[3, 0.5, 4, 1.5]]
fig.plot(data=data, style="r", color="dodgerblue", pen="2p,black")

# RECTANGLE 2
# width/height are given via the style parameter
fig.plot(x=3, y=1.5, style="r4/1.5", color="dodgerblue", pen="2p,black")

# ROUNDED RECTANGLE 1
data = [[4.5, 1, 1.25, 4, 0.5]]
fig.plot(data=data, style="R", color="seagreen", pen="2p,black")

# ROUNDED RECTANGLE 2
# width/height/radius are given via the style parameter
fig.plot(x=5.0, y=1.0, style="R1.25/4/0.5", color="seagreen", pen="2p,black")

# PIE WEDGE 1
data = [[6.0, 0.5, 2.5, 45, 330]]
fig.plot(data=data, style="w", color="lightgray", pen="2p,black")

# PIE WEDGE 2
# radius/startdir/stopdir are given via the style parameter
fig.plot(x=6.0, y=1.5, style="w2.5/45/330", color="lightgray", pen="2p,black")

fig.show()
Total running time of the script: ( 0 minutes 2.118 seconds)